
Update 29 September 2023: I added the raw data. It is also possible to download the CSV file.
Dear reader,
This is definitely not a newsletter article I imaged I would write when I relaunched LOGOecon in June. But it really feels at home with the kind of topics I want to cover.
Unless you live under a rock, you have not missed an important presentation that happened last month at the NBER Summer Institute: Florian Ederer presented a working paper he co-authored with Paul Goldsmith-Pinkham and Kyle Jensen. They were able to identify IP addresses of people posting in EJMR, the toxic cesspool where a non-trivial number of economists share racist, misogynistic, homophobic, and transphobic delicacies about their colleagues. These IP addresses show that people in all institutions, including in so-called “elite” institutions, happily wade in this cesspool.
The presentation was live-streamed on YouTube — a replay is available here. Thanks to a lucky turn of events (more on that below), I was able to record the live number of “Viewers” during the presentation, discussion included. As you can see in the plot below, the number of “Viewers” peaked at more than 1900 viewers.
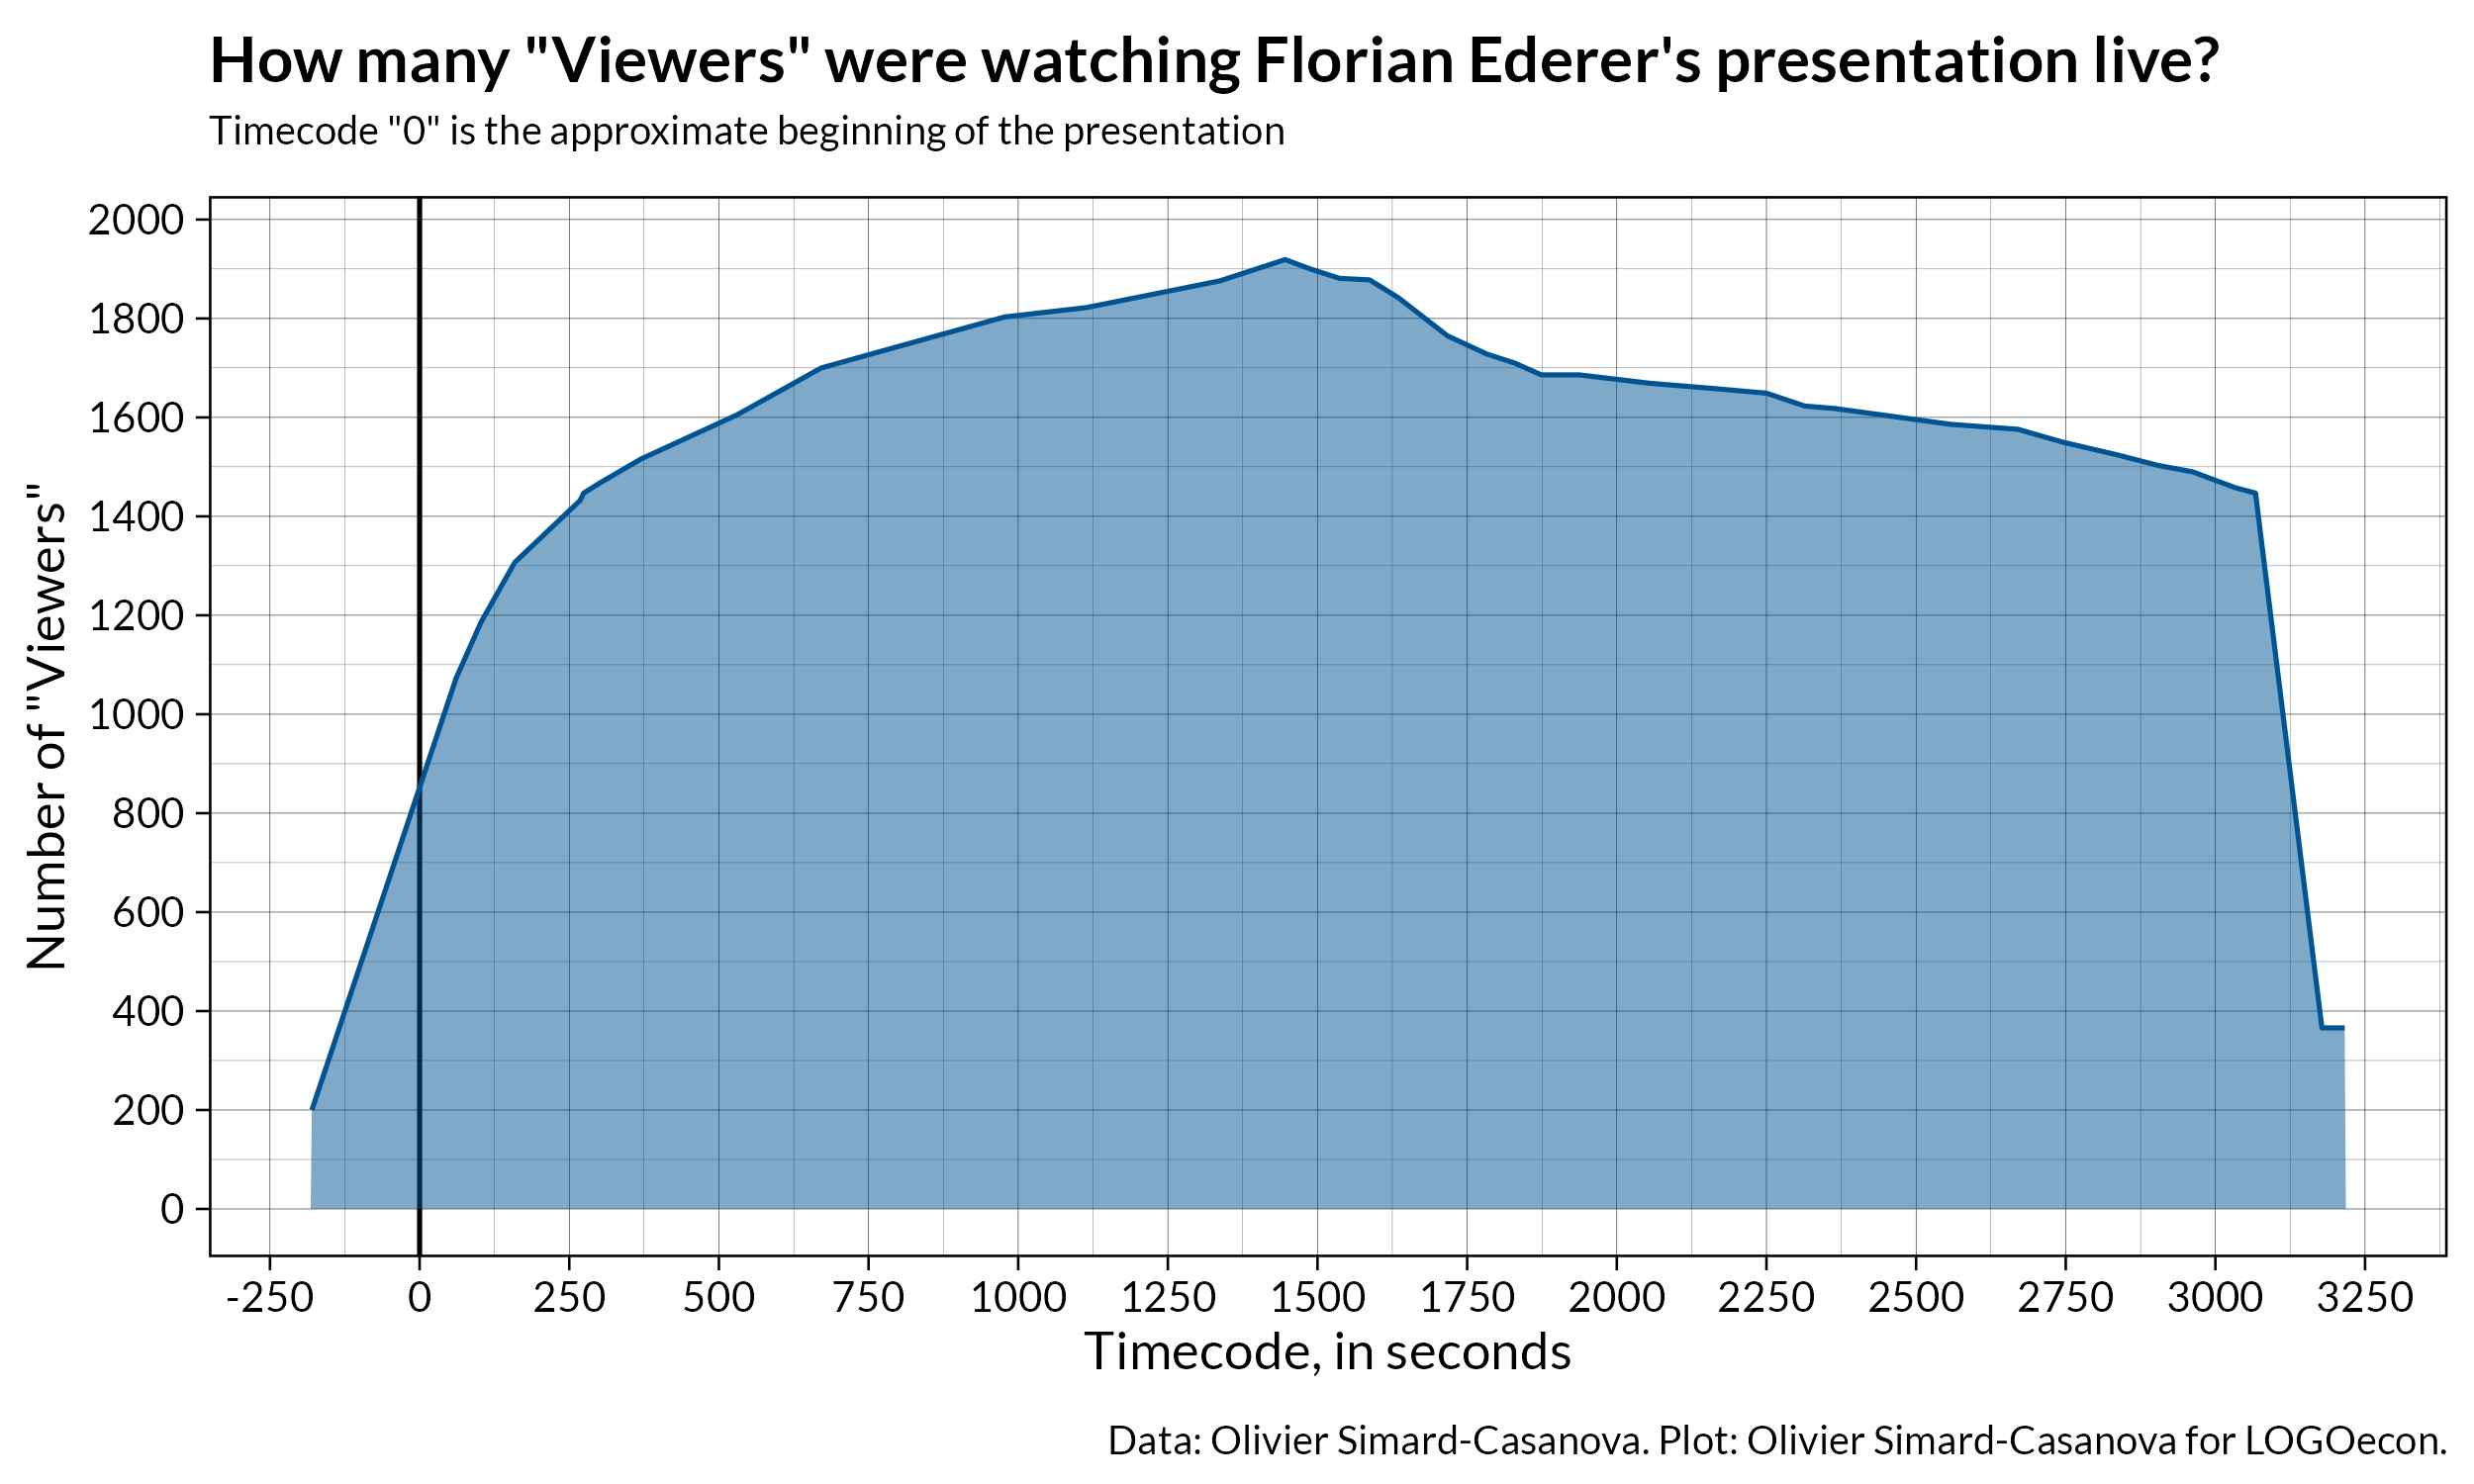
I do not have data for other well-known economics presentations, but I would not be surprised if Florian’s presentation was one of, if not the most, watched econ seminar in history.
Before I dive into how I got the data, a quick observation: thanks to modern technology, scientific presentations can now reach an unprecedented number of people. Not all scientific presentations are destined to have thousands of viewers. But the fact that some can reach such numbers is truly amazing to me. Can you imagine a seminar with up to 1900 people in the room eating popcorn, sorry, listening? I would not be surprised if these tools help to reduce (to a certain extent) the negative effects of institutional barriers and geographical distance in academia.
Now, the data. How did I get it? Well, contrary to Florian, Paul and Kyle, I had no need to develop a complex (and frankly, impressive) strategy to exploit a hash algorithm implemented so poorly that you are left wondering how many other massive privacy loopholes still exist on EJMR. What happened is a lot more mundane.
I started to watch the presentation on my iPad. I quickly realized that the YouTube app has a “Viewers” item in its interface (during a live, you can access it by taping on the description of the video — where … more is located). I basically took multiple screenshots during the presentation, and I extracted the numbers of “Viewers” ex-post.
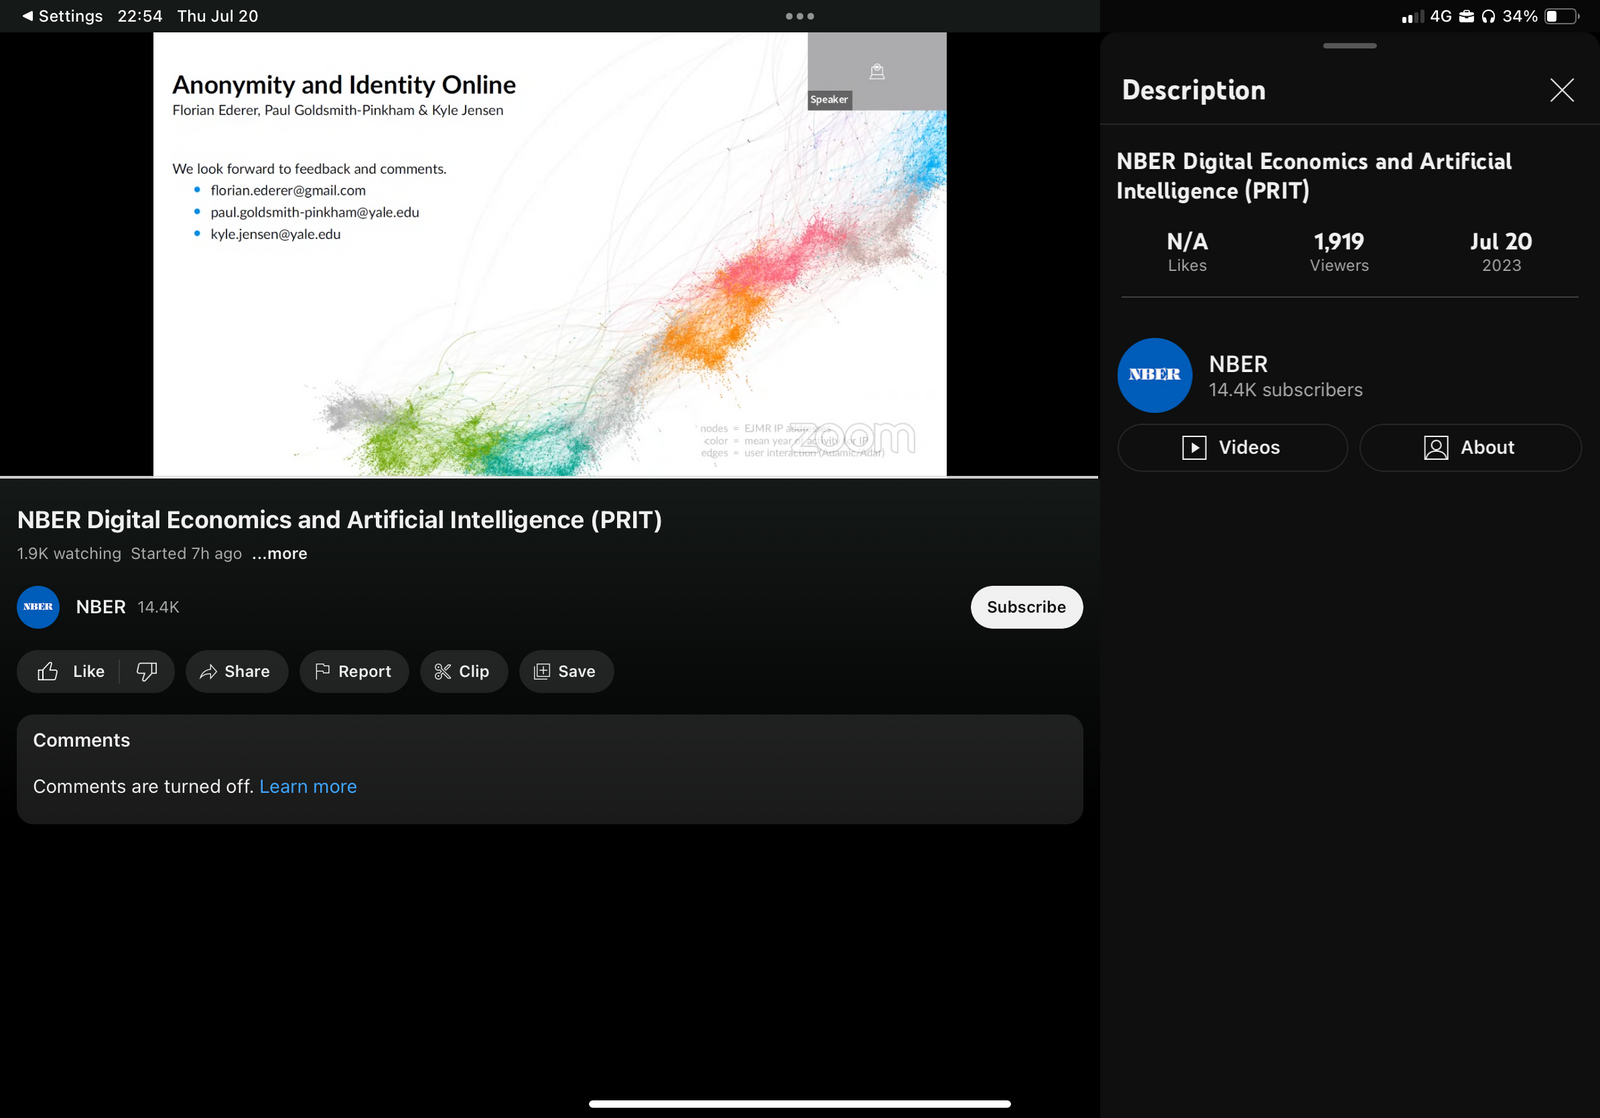
I needed two pieces of data from the screenshots: the timecode, and the number of viewers. As I have 37 screenshots, it made sense to automate part of this work.
I used R (obviously) to extract the timecode. Each screenshot taken on iOS and iPadOS comes with EXIF metadata, including the exact time it was taken (including seconds). The exifr package makes possible to extract and work with EFIX metadata in R. As EXIF data gives the date and the time when the image was taken, I used lubridate to remove the date and turn the time into an actual timecode – with 0 being the approximate beginning of the presentation. The presentation started at 22h30 my time (10:30 PM), so I subtracted 1350 minutes to the time.
mutate(
  time_code = hms::as_hms(time_code) - dminutes(1350)
)
Code language: R (r)
I exported an Excel file with the end result, and I manually recorded the number of viewers from each screenshot (I probably could have used some OCR to do that, but it felt overkilling).
Here is the raw data, and a link to download the CSV file.
| Time code | Viewers | Note |
|---|---|---|
| -180 | 200 | Estimate based on my own recollection |
| 61 | 1073 | |
| 103 | 1187 | |
| 159 | 1307 | |
| 268 | 1432 | |
| 274 | 1447 | |
| 306 | 1471 | |
| 370 | 1516 | |
| 530 | 1605 | |
| 671 | 1700 | |
| 977 | 1803 | |
| 1114 | 1822 | |
| 1337 | 1876 | |
| 1446 | 1919 | |
| 1488 | 1900 | |
| 1537 | 1881 | |
| 1587 | 1878 | |
| 1635 | 1842 | |
| 1717 | 1765 | |
| 1783 | 1728 | |
| 1829 | 1710 | |
| 1874 | 1686 | |
| 1937 | 1686 | |
| 2055 | 1669 | |
| 2156 | 1659 | |
| 2250 | 1649 | |
| 2314 | 1623 | |
| 2364 | 1618 | |
| 2558 | 1586 | |
| 2670 | 1576 | |
| 2745 | 1550 | |
| 2837 | 1524 | |
| 2904 | 1503 | |
| 2962 | 1490 | |
| 3033 | 1458 | |
| 3067 | 1447 | |
| 3178 | 366 | |
| 3216 | 366 |
Last, but not least, what is a YouTube “Viewer” exactly? It is not completely clear to me. Based on this (unclear) support page from Google, it seems that a viewer is basically one “device” that is streaming the live feed. The support page explains what the person streaming is seeing on the interface, not what the person watching is seeing on the interface. I am assuming that “Viewer” has the same definition for both streamers and watchers.
If a person has two devices streaming the same live (for instance, a smartphone and a computer), I am assuming it would count as two viewers (unless Google can correct the count if a given logged-in account is streaming the same feed twice?). One “device” streaming the live feed can be seen by multiple people, so the number of “Viewers” is only an approximate measure of the actual number of people watching live.
Despite these precautions and limitations, the number of “Viewers” is probably a decent approximation of the actual number of people who watched the presentation live. (As the presentation is available on replay, the total number of “Viewers” is now above 1900, and will continue to increase for as long as the replay stays online.)
It was an interesting plot to make, even if the underlying paper comes with grim, albeit completely unsurprising, results. EJMR is a plague, and I hope that, collectively, we will be able to get rid of it. The sooner, the better.
Feel free to subscribe to LOGOecon, my economics newsletter, to not miss my upcoming articles. You can do it down below, or here.
Olivier