Dear R enthusiasts,
Welcome to the first Tutorial I publish on CodeHub! Tutorials are a new format where I will share tips to get the most out of R, and to improve coding skills.
In this first Tutorial, I would like to share an elegant solution to plot mathematical functions with ggplot2.
A simple function
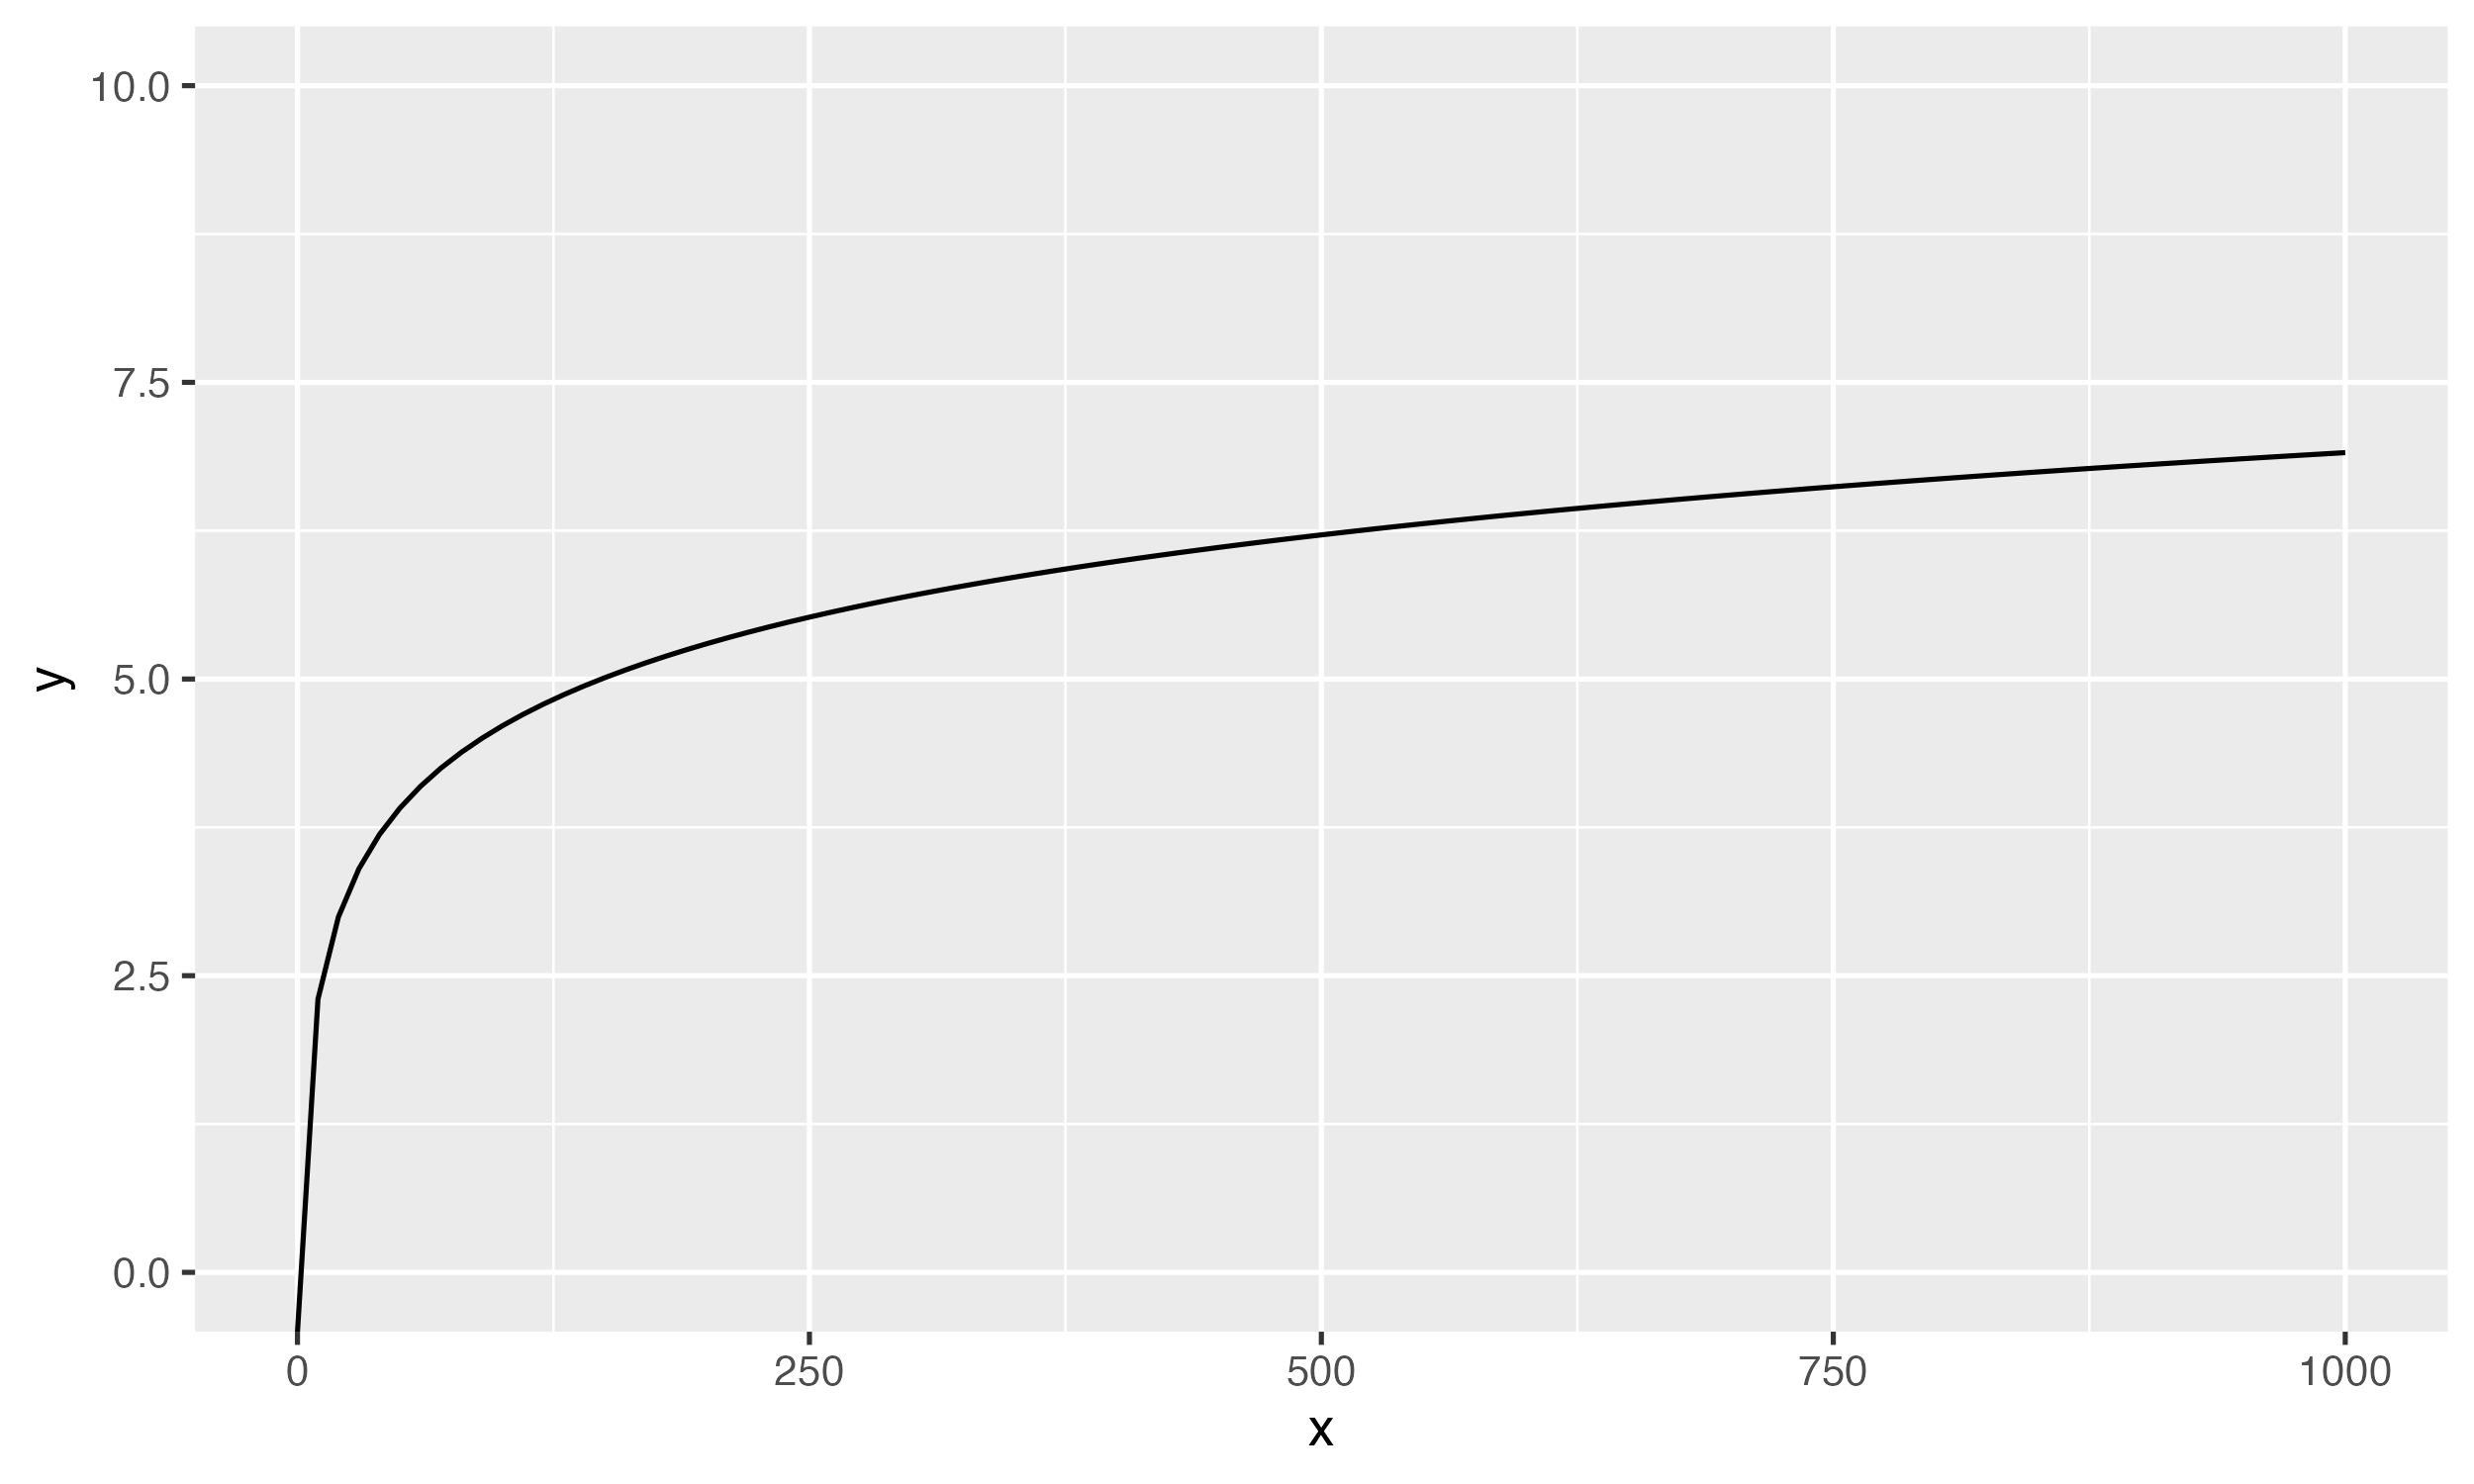
Let’s begin with a simple function: a logarithm.
f \left( x \right) = \ln x
We want to produce the following plot.
Often, when I read tutorials to plot functions with ggplot2, they do the following:
- Generate a data frame from the function
- Plot the data frame
I find this method cumbersome, especially if we want to edit the function as we need to regenerate the data frame. More steps mean a higher chance to introduce bugs and errors. It is also not particularly elegant. What I want is to plot the function by specifying it symbolically, i.e., without generating an intermediary data frame. This is possible thanks to geom_function().
geom_function() takes at least one argument: fun. To plot a logarithm, we can use the built-in log() function.
geom_function(
    fun = log
)
Code language: R (r)
The following code produces Figure 1:
ggplot() +
    geom_function(
        fun = log
    ) +
    scale_x_continuous(
        limits = c(0, 1000)
    ) +
    scale_y_continuous(
        limits = c(0, 10)
    ) +
    labs(
        x = "x",
        y = "y"
    )
Code language: R (r)
I use scale_continuous() and limits to specify the limits of the axes.
So far, so good. But what if we want to plot a more complicated function? What if we want to have a lot more control over the function we plot?
A more complicated function
Let’s say we want to plot a logistic function.
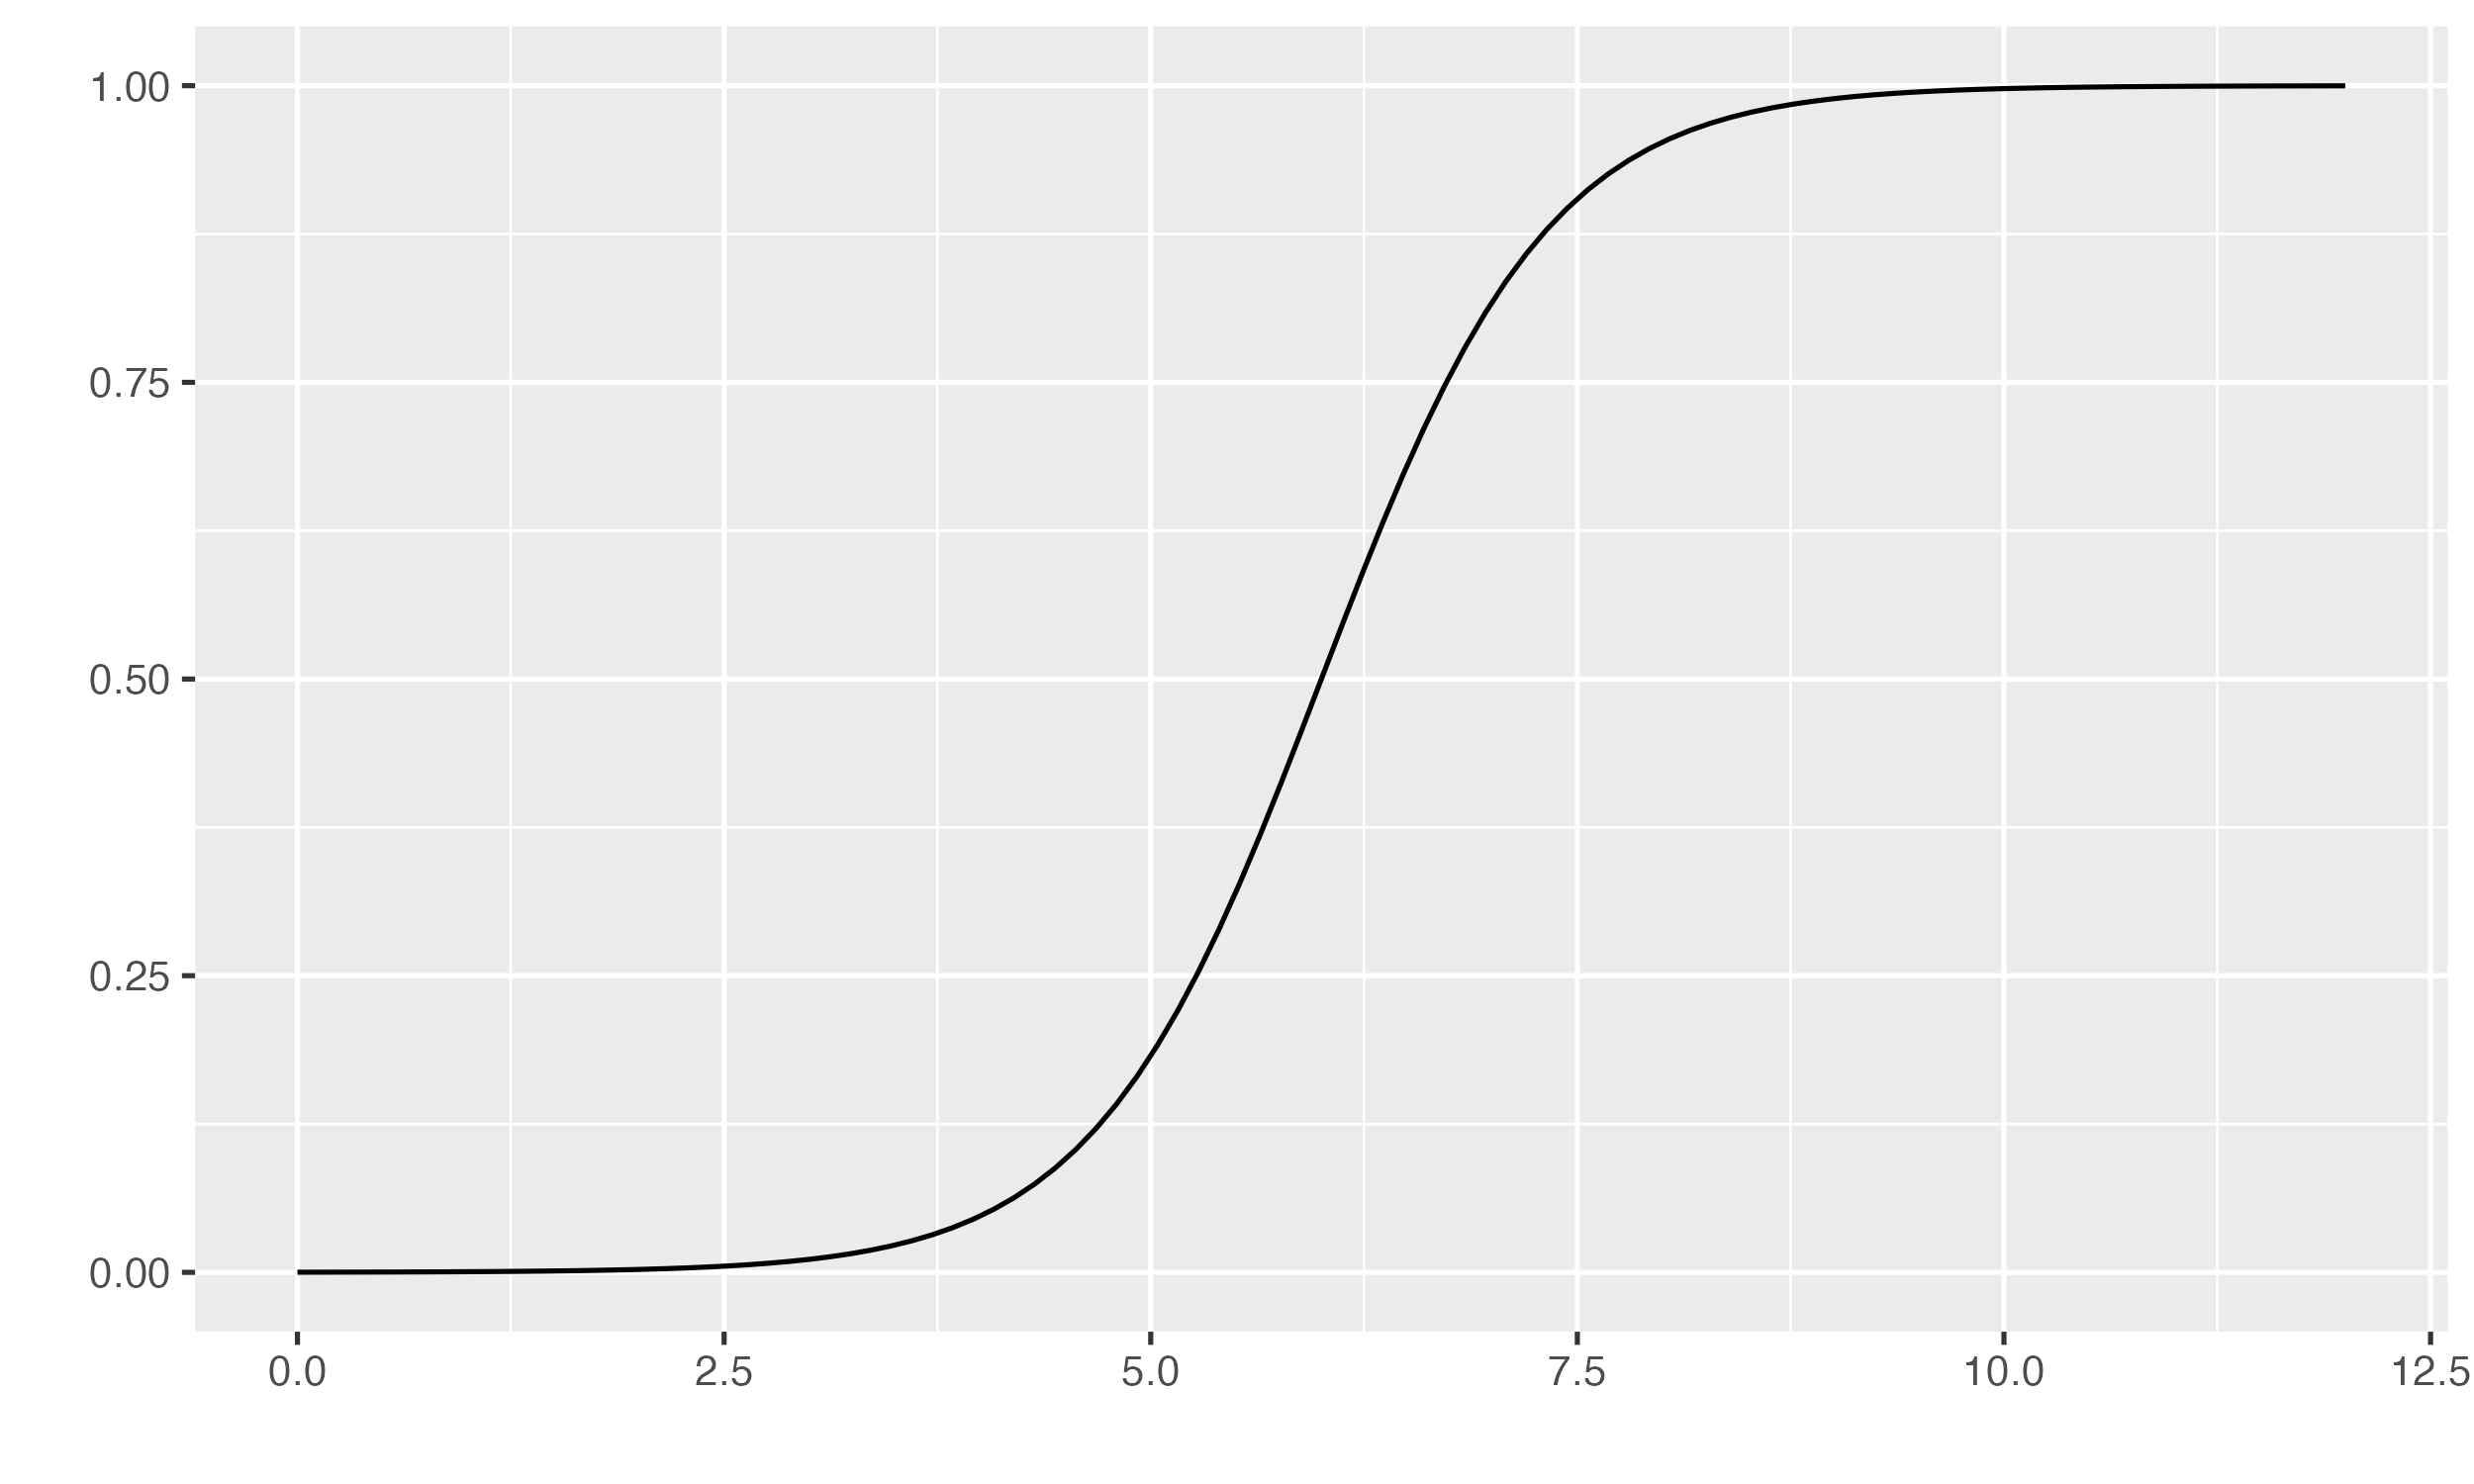
The general equation of a logistic function is the following:
f \left( x \right) = \frac{L}{1 + e^{- k \left( x + x_0\right)}}- L is the supremum, i.e., the maximum value the curve reaches on the plot
- k is the growth rate, i.e., the steepness of the curve
- x_0 is the midpoint
Similar to log(), R has a built-in function to work with logistic functions. But let’s say we want to specify all parameters ourselves. Or we want to use a modified form of a sigmoid function. Used in conjunction with geom_function(), as_function() makes all this possible.
With as_function(), we can manually specify the mathematical function we want to plot. With as_function(), we have complete control.
The following code produces Figure 2, with L = 1 , k = 1.5 and x_0 = 6 .
library(rlang)

supremum <- 1
growth_rate <- 1.5
midpoint <- 6

ggplot() +
    geom_function(
        fun = as_function(
            ~ (supremum)
                /
                (1 + exp(-1 * growth_rate * (.x - midpoint)))
                )
    ) +
    scale_x_continuous(
        limits = c(0, midpoint * 2)
    ) +
    scale_y_continuous(
        limits = c(0, 1)
    ) +
    labs(
        x = "x",
        y = "y"
    )
Code language: R (r)
Let’s break down the code.
First, we need to load rlang to use as_function(). If you use the Tidyverse, rlang should already be installed. If you do not use the Tidyverse, you probably need to install it.
Second, I defined three variables that store the values of the parameters. I could have hard coded the values directly in as_function(). But defining variables makes the code easier to read. It also makes easier to change the value of the parameters. A clearer and simpler code is a code that is less prone to bugs and errors.
Third, the rest. It looks a lot like the code we wrote to plot the logarithm, but with some differences.
fun now calls as_function(). The syntax of as_function() is the following:
as_function(~ .x)
Code language: R (r)
~ tells as_function() what is on the right-hand side of the equation. .x is basically a computational representation of the mathematical x .
Fun fact: if you use as_function(~ .x), it plots a linear function (try it!).
One important thing to note: inside as_function(), you need to explicitly write * everywhere there is a multiplication. R, or at least as_function(), is not able to infer multiplication. Without writing *, R interprets var() as a call to a function named var. With var * (), R knows that we want to multiply the numerical value stored in the variable named var with what is inside the parentheses.
Wrapping up
So here it is! You know how to plot any arbitrary function with ggplot2.
If you enjoyed this Tutorial, please share it on social media and in your network. To not miss my future Tutorials on R and coding, you can also subscribe to CodeHub’s newsletter below — or here.
Olivier